Optimisations
I have regularly optimised Coral Engine throughout the year. I tracked some optimisations I made to the visual scripting interpreter over the course of one week.
Workflow
I created a small tool for benchmarks. It runs the level for 1 real-world minute and measures the average delta time. Each benchmark ran with various amounts of enemies. This allowed me to accurately and consistently measure the result of my optimisations. After each change, I ran the benchmark to confirm it had a positive effect. I use Visual Studio’s profiler to determine the most problematic areas.
Benchmark
The environment consisted of enemies moving from point to point.

The behavior of an individual enemy.
Initial benchmark
| N | 1e2 | 1e3 | 1e4 | 1e5 | 1e6 |
|---|---|---|---|---|---|
| Average deltatime (Ns) | 9.61E+05 | 9.11E+06 | 9.12E+07 | 9.24E+08 | 1.24E+10 |
| Standard deviation (Ns) | 1.51E+05 | 9.37E+05 | 6.01E+06 | 1.34E+08 | 6.05E+09 |
N: The number of enemies. Average deltatime (Ns): The average delta time. The first frame has been left out, as it takes much longer than all the other frames and it would skew the results. Standard deviation (Ns): How dispersed the delta time is in relation to the mean.
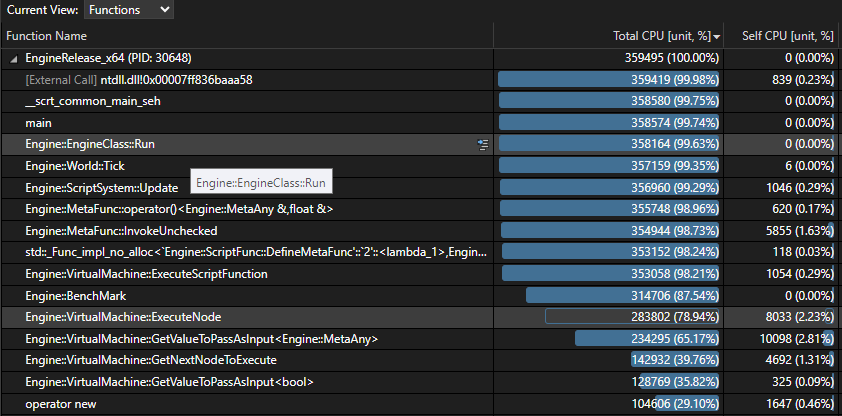
I analyze the overview to figure out which functions require the most optimisation. I thoroughly examine the function calls that took up the highest total CPU time to figure out which lines require the most optimizing, and if there is any low-hanging fruit that can be easily optimised.
std::vector in a hot-loop
Before

Executing each node requires collecting the inputs that we need to pass in. We executed a lot of nodes, and a lot of time was being spent on allocating a new vector for all of them.
	// Collect the inputs that this node needs
	std::vector<MetaAny> valuesToPassToNode{};
	std::vector<TypeForm> valueForms{};
After
We know the number of inputs that the node has, so we can easily reduce this to a single stack allocation using alloca.
	// Stack allocation
	MetaAny* inputValues = static_cast<MetaAny*>(_alloca(numOfInputPins * sizeof(MetaAny)));
	TypeForm* inputForms = static_cast<TypeForm*>(_alloca(numOfInputPins * sizeof(TypeForm)));
Final result: 18.26% faster
| N | 1e2 | 1e3 | 1e4 | 1e5 | 1e6 |
|---|---|---|---|---|---|
| Average deltatime (Ns) | 1.11E+00 | 1.01E+01 | 1.00E+02 | 9.86E+02 | 1.17E+04 |
| Standard deviation (Ns) | 2.88E-01 | 1.75E+00 | 7.39E+00 | 2.40E+01 | 8.15E+02 |
std::unordered_map slow emplace
Before
The cache was an unordered_map, but emplacing elements into the map took up too much time.
After
context.mCachedValues.reserve(func.GetNodes().size() * 5);

// Populate the cache for faster lookup later
for (const ScriptPin& pin : func.GetPins())
{
	context.mCachedValues.emplace_back(pin);
}

// Binary search requires sorted vector
std::sort(context.mCachedValues.begin(), context.mCachedValues.end());
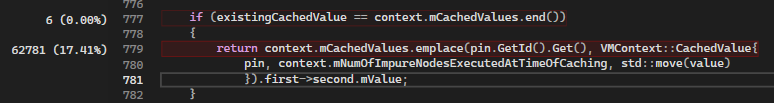
Searching through a vector is normally a linear process, but by utilizing binary search we can reduce this to O(Log(N)). The search time was now roughly the same as with the unordered_map.
// Binary search
auto existingCachedValue = std::lower_bound(context.mCachedValues.begin(), context.mCachedValues.end(), pin.GetId());
ASSERT(&existingCachedValue->mPinOfOrigin.get() == &pin);
return *existingCachedValue;
Final result: 29.64% faster
| N | 1e2 | 1e3 | 1e4 | 1e5 | 1e6 |
|---|---|---|---|---|---|
| Average deltatime (Ns) | 9.61E+05 | 9.11E+06 | 9.12E+07 | 9.24E+08 | 1.24E+10 |
| Standard deviation (Ns) | 1.51E+05 | 9.37E+05 | 6.01E+06 | 1.34E+08 | 6.05E+09 |
O(N) to O(1)
Before
All the operations to go find a node, pin, or link by its ID were O(N), it was a simple, but slow, linear search.

The pins were all over the place in memory, with each node having a separate vector for both its input and output pins.
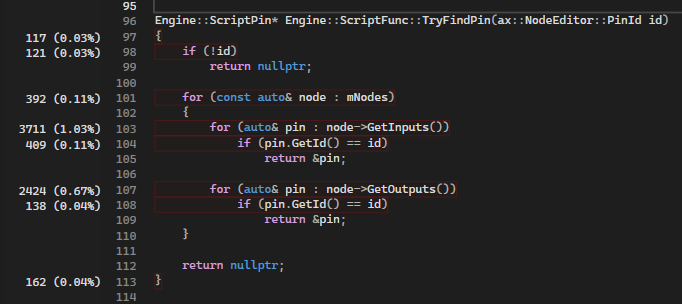
The percentages were low in the profiler, but they showed up in several different places and added up together, it became apparent that searching for an element was one of the slowest parts, and it would scale poorly with larger functions.
After
By not erasing elements from the container but instead marking them as null, we can start using the ID as an index to the element in the array.
void Engine::ScriptFunc::RemoveLink(LinkId linkId)
{
	ScriptLink* link = TryGetLink(linkId);

	if (link == nullptr)
	{
		LOG(LogAssets, Warning, "Link was already removed");
		return;
	}

	link->SetId(LinkId::Invalid);
}
We no longer have to sort the cache by the pin ID at the start, because all the pins will already be sorted in a contiguous buffer.
Engine::VirtualMachine::VMContext::CachedValue& Engine::VirtualMachine::FindCachedValue(VMContext& context,
	const ScriptPin& pin)
{
	return context.mCachedValues[pin.GetId().Get() - 1];
}
Final result: 20.81% faster
| N | 1e2 | 1e3 | 1e4 | 1e5 | 1e6 |
|---|---|---|---|---|---|
| Average deltatime (Ns) | 6.28E+05 | 5.78E+06 | 5.78E+07 | 5.99E+08 | 1.10E+10 |
| Standard deviation (Ns) | 1.43E+05 | 9.51E+05 | 6.09E+06 | 2.25E+08 | 1.19E+10 |
POD optimisation
Before
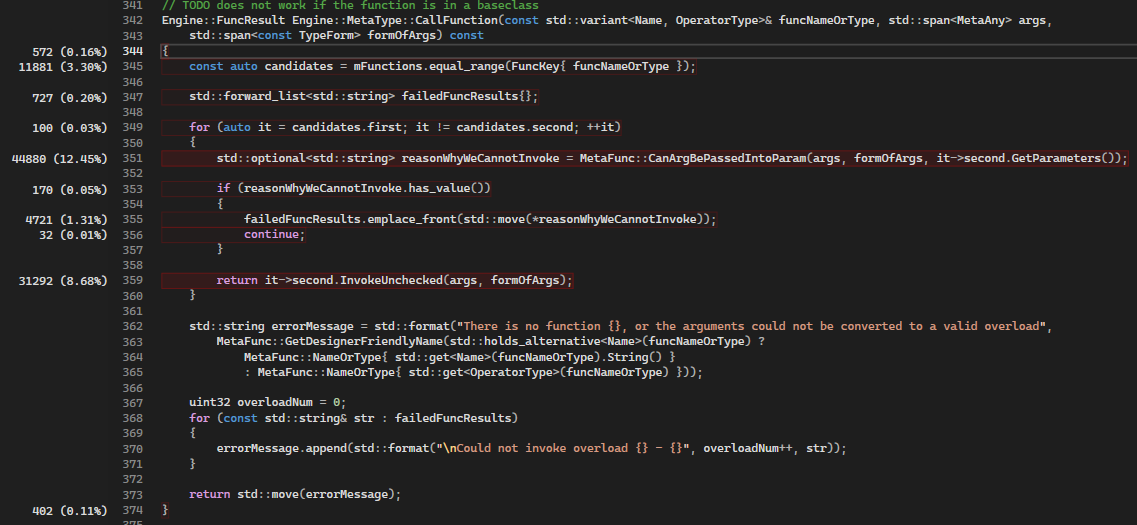
12% of our execution is spent on resolving overloads between constructors (default, copy & move). 8.7% is spent on invoking a function that constructs the object.

15% of our time is spent on calling the destructor.
A lot of time was spent on constructing/destructing POD types, (such as integers, floats, vec3, etc.). This required looking up the type, looking up the necessary function, resolving any overloads, and finally invoking a std::function.
After
Rather than addressing the symptom, which is that a lot of time is spent in constructing and resolving overloads, I decided to address the root of the problem; that the constructors and destructors are being called at all. The fastest code is code that does not run. I now keep track of which types are plain old data.
#define NUM_OF_BITS_FOR_SIZE 14
#define NUM_OF_BITS_FOR_ALIGN 6

struct TypeInfo
{
	TypeId mTypeId{};
	uint32 mSize : NUM_OF_BITS_FOR_SIZE {}; // Max size is 16384
	uint32 mAlignment : NUM_OF_BITS_FOR_ALIGN{}; // Max alignment is 64
	uint32 mIsTriviallyDefaultConstructible : 1 {};
	uint32 mIsTriviallyMoveConstructible : 1 {};
	uint32 mIsTriviallyCopyConstructible : 1 {};
	uint32 mIsTriviallyCopyAssignable: 1 {};
	uint32 mIsTriviallyMoveAssignable : 1 {};
	uint32 mIsDefaultConstructible : 1 {};
	uint32 mIsMoveConstructible : 1 {};
	uint32 mIsCopyConstructible : 1 {};
	uint32 mIsCopyAssignable : 1 {};
	uint32 mIsMoveAssignable : 1 {};
	uint32 mIsTriviallyDestructible : 1 {};
	uint32 mUserBit : 1 {};
};
static_assert(sizeof(TypeInfo) == 8);
This opens up a lot of doors in other places for optimisation by avoiding lookups and function calls for POD.
// We only have to invoke the destructor if this type is not trivially destructible
if (!mTypeInfo.mIsTriviallyDestructible)
{
    const MetaType* const type = TryGetType();

    if (type != nullptr)
    {
        type->Destruct(MetaAny{ mTypeInfo, mData }, false);
    }
    else
    {
        LOG(LogMeta, Error, "Cannot call destructor for type with id {}: Type was not reflected", GetTypeId());
    }
}
Final result: 142.35% faster
| N | 1e2 | 1e3 | 1e4 | 1e5 | 1e6 |
|---|---|---|---|---|---|
| Average deltatime (Ns) | 2.70E+05 | 2.51E+06 | 2.51E+07 | 2.51E+08 | 3.09E+09 |
| Standard deviation (Ns) | 5.31E+04 | 2.84E+05 | 2.37E+06 | 2.26E+07 | 7.55E+08 |
Simple lookup cache
Before
When executing a node, I had to look up the address of the function to call each time.
After
I now only look up the address once during the compilation stage.
Final result: 35.57% faster
| N | 1e2 | 1e3 | 1e4 | 1e5 | 1e6 |
|---|---|---|---|---|---|
| Average deltatime (Ns) | 2.25E+05 | 2.03E+06 | 2.02E+07 | 2.08E+08 | 2.18E+09 |
| Standard deviation (Ns) | 4.79E+04 | 2.41E+05 | 1.82E+06 | 1.78E+07 | 5.45E+08 |
Results
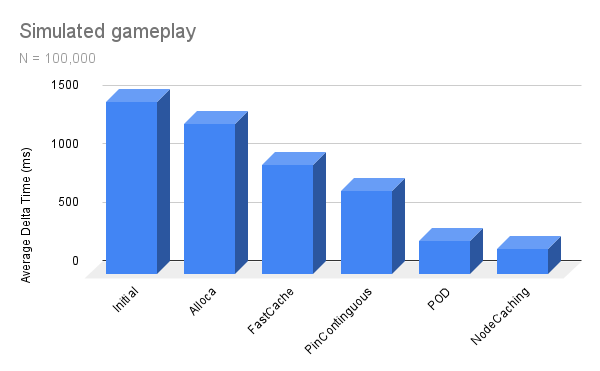
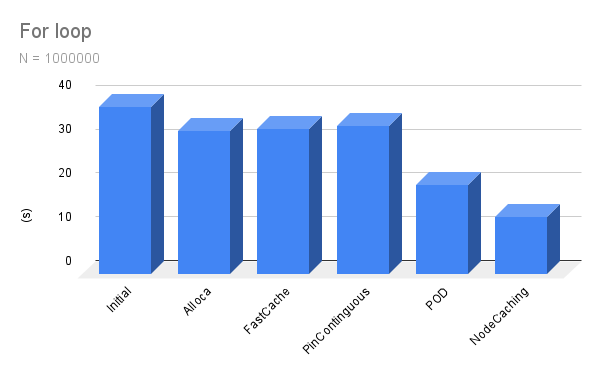
The total performance improvement was 718.87%, achieved over the course of two days.
I went from O(N) to O(1), which allows for the execution of much larger functions.
The tool is designed for simple prototyping and gameplay, yet the scripts were still executed at 50fps when faced with 10’000 enemies.